It works! It works
Well something works, more particularly you can now plot strings…So that thing
I mentioned in the very bottom of my very first post-that we could hopefully simplify bar enough that users can quit with the range(labels) madness-is now a thing that is possible. So this:
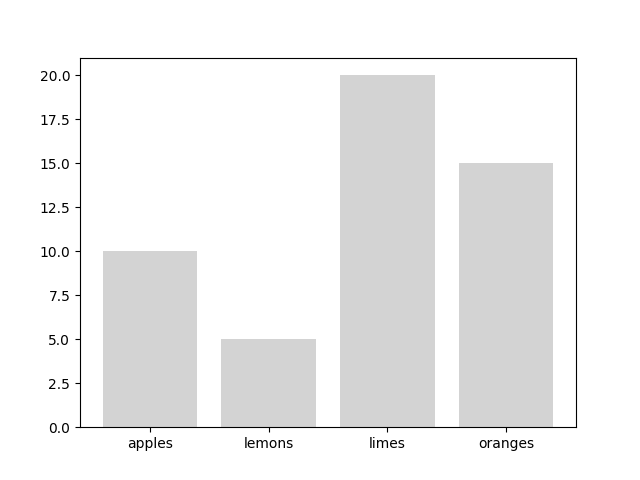
can now be created using this:
data = {'apples':10, 'oranges':15, 'lemons':5, 'limes':20}
fig = plt.figure()`
ax = fig.add_subplot(1,1,1)`
ax.bar(data.keys(), data.values(), align='center', color='lightgray')
ax.xaxis.set_tick_params(size=0)
which makes me so very happy ‘cause one less level of abstraction always rocks. And yes, having to create arbitrary indexes for labels is an abstraction.
Note: Python 3+ dicts are special and so you need to do this to make it work:
ax.bar(list(data.keys()), list(data.values()), align='center', color='lightgray')
And yes, a new item on my todo list is now: add builtin support for Python 3 dicts into matplotlib ‘cause the thought of having to explain views to newbies (or frankly most people) makes me shudder. The official Python 3 documentation is terrible for this ‘cause it commits the cardinal sin of explanation by using the term it’s trying to explain in the explaination:
They provide a dynamic view on the dictionary’s entries, which means that when the dictionary changes,
the view reflects these changes.
But wait! Bar’s aren’t the only thing that can now eschew manual remapping. Because the unit conversion interface is being used, all sorts of things come for free. Line plots of every variety (1d, 2d, with labeling & without), scatter plots, and DateFrame objects. Series categorical object support is in the works. Here’s just one example of all the great new categorical-no more range(thing I really care about plotting)-support:
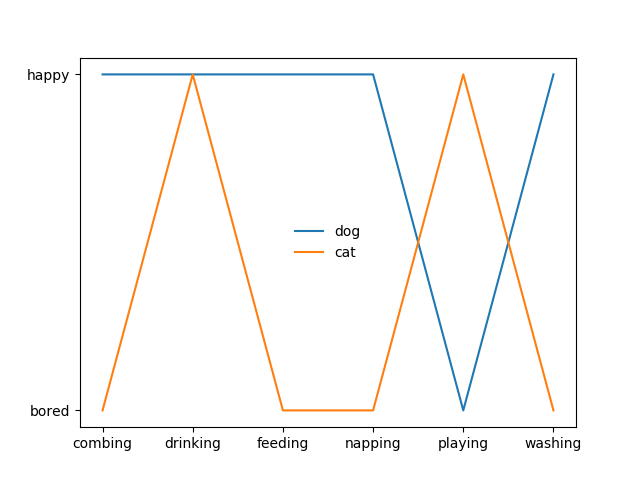
which is:
cat = ["bored", "happy", "bored", "bored", "happy", "bored"]
dog = ["happy", "happy", "happy", "happy", "bored", "happy"]
time = ["combing", "drinking","feeding", "napping", "playing", "washing"]

fig = plt.figure()
ax = fig.add_subplot(1,1,1)
ax.plot(time, dog, label="dog")
ax.plot(time, cat, label="cat")
ax.legend()
So next in the pipeline is cleaning the code up a bit more, folding in support for dicts & series, writing better docs and matplotlib examples (…maybe changing the default bar example)-basically cleaning up the PR enough so that it gets merged. And then it’s on to the 2nd part of the project…there are a few possible directions…
DISCLAIMER: As this PR hasn’t been merged in yet, these features are currently available in my branch of matplotlib.