My GSOC log
-
Clearly Color Categories
As a grad student, I work a lot with satellite data. This satellite data sometimes has categorical information like whether the pixel is from a broken detector or it’s nightime in that pixel or ocean. Often this data also measures something, and both these things should go on a plot(please forgive the colors):
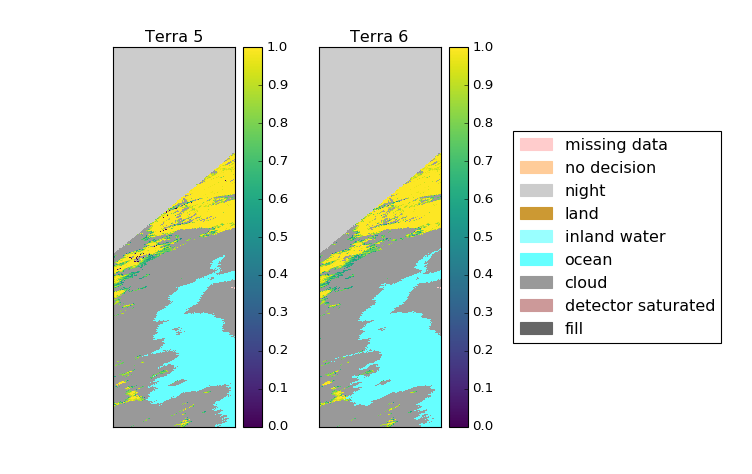
import matplotlib.colors as mcolors
import matplotlib.cm as mcm
import matplotlib.patches as mpatches

# Create a custom color scheme for the missing value codes
colors = ["#FFCCCC", "#FFCC99", "#CCCCCC",
          "#CC9933", "#99FFFF", "#66FFFF",
          "#999999", "#CC9999", "#666666"]
mcmap = mcolors.ListedColormap(colors)
mnorm = mcolors.BoundaryNorm([200, 201, 211, 225, 237,239, 250, 254,255, 260], mcmap.N)
#make proper legend for the missing data
labels = ['missing data', 'no decision', 'night',
         'land', 'inland water', 'ocean',
         'cloud', 'detector saturated', 'fill']

def plot_fsc(fig, ax, snow, codes):
    cd = ax.imshow(codes, cmap=mcmap, norm=mnorm, interpolation='nearest')
# everything else omitted

patches = [mpatches.Patch(color=c, label=l) for c, l in zip(colors, labels)]
ax3.legend(patches, labels, ncol=1, loc=6)
Even edited such that the non-categorical stuff is omitted, that’s a lot of boilerplate. But, even worse, it’s confusing as all out because 260 isn’t even in the data but necessary to exploit
BoundaryNorm, which assigns colors based onlower bound <= value < upper bound. This is confusing enough when the categories are nominally numerical, but it’s even more problematic when the data is numerical. So my [WIP] categorical color pull request aims to simplify the hoops and make it easier to keep track of which colors are attached to what categories. The aim is to be able to create the above image with something like the following code:import matplotlib.category as cat codings = [('missing data', '#FFCCCC'), ('no decision', '#FFCC99'), ('night', '#CCCCCC'), ('land', '#CC9933'), ('inland water', '#99FFFF'), ('ocean', '#66FFFF'), ('cloud', '#999999'), ('detector saturated', '#CC9999'), ('fill', '#666666')] cmap, norm = cat.colors_from_categories(codings) fig, ax = plt.subplots() sm = ax.imshow(data, cmap=cmap, norm=norm) ax.legend()There will also likely be the ability to pass labels into legend in case the data is encoded in integers, like the satellite data. The first step in this has been to develop a
CategoryNormthat maps a list of categories to colors directly and doesn’t rely on them being contiguous. This has the added bonus of allowing users to select the categories they care about without having to explicitely create a mask. -
Overcommitting is a terrible flaw
During my last weekly meeting with one of my mentors, I admitted that I was a bad GSOCer ‘cause I was terribly overcommited. And ‘tis true…missed out last weeks post ‘cause was flailing under todos for my grad school career and ‘cause I’ve been mentoring high schoolers all summer and their end of year poster was due Friday. I also taught 20 of them for a week and am now buried under a mound of grading. This is about the moment when I’m quite thankful that my advisors are quasi-academics as they understand this well. But I did get something done last week:
Read More...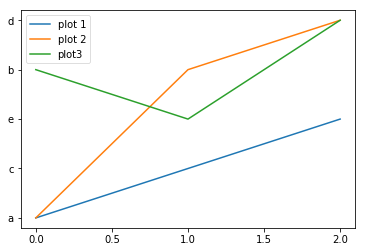
-
Learning Curves
I wanna start with a shout out to Numpy core developer Jaime Fernández del Río for essentially drafting a starter guide to Numpy C development in response to my asking the mailing list for help getting oriented. I kinda feel that this may be one of the most useful things to come out of my GSOC project. Also, now I’m kinda venturing down a side rabbit hole of Python C & Numpy C dev, but at least it’s well guided. In a quasi-related note, I got the matplotlib readme updated so it includes contribute info.
I also have much appreciation for my mentor @tacaswell for voicing confidence in my skills, ‘specially as a few days back I was treated to some condescension towards my Pandas skills (note: this is another library I teach fairly often, but even if I was a newbie it would still be not okay). As I get deeper into the weeds in the Python, Numpy, & Matplotlib community, I honestly get more amazed at how generally kind and friendly the community generally is. It’s-possibly/probably sadly-just a little bit surprising ‘cause I’m used to increasing hostility the closer a community gets to the OS level.
Read More... -
Swimming upstream
This week I’m struggling with the joys? of upstream changes and trying to sort out where support should happen and where it realistically will happen. The story starts with a somewhat major change between Python 2 and Python 3, namely that given a dictionary
d = {'a':1, 'b':2, 'c':3},d.keys(),d.values(), andd.items()now return dictview objects. Now deep down the matplotlib stack, data almost always gets converted into a numpy array…and that’d be fine ‘cept this is what happens when you try to turn view into an array:Read More...In [6]: np.asarray(d.keys()) Out[6]: array(dict_keys(['c', 'a', 'b']), dtype=object) In [7]: np.array(d.keys()) Out[7]: array(dict_keys(['c', 'a', 'b']), dtype=object) -
How to workflow
Let’s talk workflow ‘cause I’ve spent a rather insane amount of time fighting with git. And while I much prefer mercurial, I’ve been using git for a few years now and so it’s not like I’m new to it. But, let me tell you about the many ways in which git and I are not friends right now. While I’ve been using version control back to when SVN was a thing, I’ve never really used version control in a large project, multiple branches & developers setting. And my go to is commit small and often…so my commit branch tends to be super muddled…
Read More... -
Why mentorship matters

image is from an old post of mine on how I learned to code
I wanna talk about the value of mentorship ‘cause I sometimes feel like my mentors feel underutilized and yet I almost feel like the poster child for “mentors for everybody”. I applied for GSOC solely for the mentorship. I’m serious here; I’d wanted to get involved with matplotlib for years and years and was insanely intimidated by the prospect. And the thing is, this wasn’t a project where there were any real barriers to entry for me: the community is super friendly, I knew the library really well (hell, even wrote a tutorial on it), been programming in Python (including the science stack) for about 8 years (programming in general for about 15), teaching programming for 6 years, and I’m an organizer for one of the largest tech meetups in NYC (NYLUG) - ugh, I sound obnoxious even to my ears, but I just want to give you a sense of just how intimidated I was (still am…) despite on paper seeming like this should totally be in my wheelhouse.
Read More... -
It works! It works
Well something works, more particularly you can now plot strings…So that thing I mentioned in the very bottom of my very first post-that we could hopefully simplify bar enough that users can quit with the
range(labels)madness-is now a thing that is possible. So this: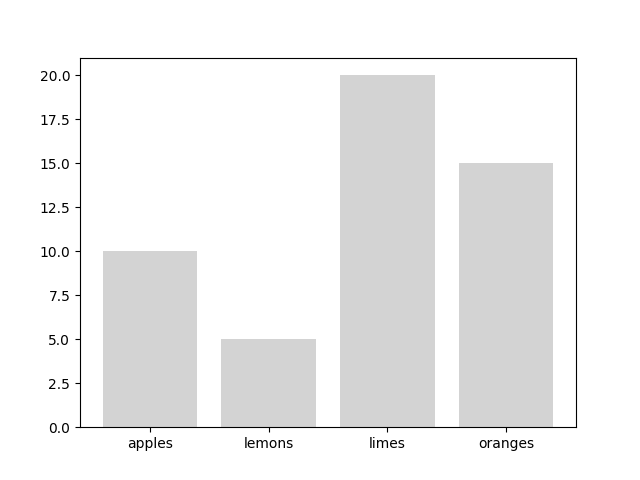
can now be created using this:
Read More... -
Code Calling Code Calling Code
This week I got knee deep in code, kinda literally. Matplotlib protocol is to wrap proposed changes in a pull request so that conversation is grounded in one place, so you can read all about my confusion at PR #6612. You’ll also see that I have a tendency to treat my code like running notes…
But let me work back to that. The starting point is that I’m writing what’s called a convertor-in matplotlib land this is the underlying mechanism that takes data that’s not numerical and plots it. I’ve been looking at a lot of Pandas date convertors & tests and mpl/dateconvertor, and mpl/jpl_units and mpl/test_units and like the title of this post implies, I’ve been going up and down the matplotlib call stack trying to sort out when the conversion functions get called. And spending a lot of time on gitter/mpl
Read More... -
This is really a usability project
So, this week I took a semi-break1 from GSOC ‘cause my fellowship ran a weeklong series of workshops that were aimed at getting academics in humanaties and the softer side of STEM up to speed with what they call “digital tools” and what the rest of us call using code & software to do things (or sometimes scientific programming). So while my cohort taught ‘em other skills, I taught some English majors, librarians, biologists, psychologists, etc… and a lot of business majors how to use pandas and sklearn. And that involved showing them code that looks like this:
Read More...comp1 = pca_weights.T[0] fig = plt.figure() ax1 = fig.add_subplot(2,1,1) ax1.bar(range(comp1.shape[0]), comp1, align='center') ax1.set_xticks(range(comp1.shape[0])) ax1.set_xticklabels(dfFV.keys(), rotation=90) ax1.set_xlim(-.5,12.5) ax1.set_ylim(-.8,.8) ax1.set_ylabel("X axis") -
A PR on Pandas?
A central question in supporting catagorical data is which libraries and how?
Matplotlib wants to avoid conditional supports because they are messy and can lead to unreasonable quote bloat quite quickly. And it puts the onus on matplotlib to maintain that the conversions work throughout api changes in the client side library (such as pandas or xray). Instead, in discussion with a pandas developer, the plan is to write the conversion code such that it lives in the library providing the data (such as pandas) and that code is registered with matplotlib.
Because the quite amazing Pandas already supports a lot of plots of its catagorical data, it makes for the perfect library to test out this plan. If this works, it will also hopefully yield a guide to adding support for your favorite library.
Read More... -
Orientation by way of housekeeping
My project, catagorical axis, intersects with all sorts of pieces of the codebase and I had no idea where to start. So, since I was feeling kind of lost and overwhelmed in the sea that is the matplotlib codebase, my mentors suggested that I do an ad-hoc literature review of the issues and pull requests to see which ones are related to my project. Since I wanted to keep track of what I’d read, I wrote a simple script to drop the issues into a csv:
Read More... -
Why bother with catagorical support?
Catagorical data, like most data, often really needs to be visualized for readability. A standard method to visualize catagorical information is via a bar chart, such as the following:
Read More...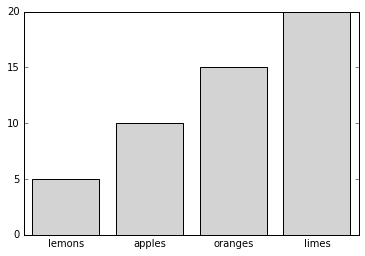
subscribe via RSS